Friday, April 22, 2016

Group Rube Goldberg

Group Rube Goldberg:

1. Video of your Rube Goldberg setup

Explanation of group Rube Goldberg

2. Videos of your Rube Goldberg in action; one fail, one success.

Failed Rube Goldberg attempt.

Successful Attempt

Monday, April 18, 2016

Ben's Individual Rube Goldberg #2

Individual Rube Goldberg #2

1. Provide an updated drawing of your set up.


2. Explain your setup.

Our Rube Goldberg project starts with an input voltage coming from the previous group into my part of the Rube Goldberg. The signal will trip a relay in my project and cause a motor to turn. The motor will shorten a string attached to it. As the string shortens it will turn a fan blade that has a stopping bar on it. As the blade turns the bar is raised allowing a Lego car to roll down a ramp and hit a marble. The marble will roll down a coarse and fall off the table into a basket, the basket will be attached to a block that will fall over onto a switch. The switch will be the beginning of Matt's set up.

3. Provide photos of the circuit and setup.

Add caption
Add caption


4. Provide at least 2 new videos of your setup in action, one being a failed attempt.


5. What failures did you have? How did you overcome them?


6. Explain your group RG setup.


7. Video of a test run of your group RG.


Sunday, April 17, 2016

Matt's Individual Rube Goldberg 2

Individual Rube Goldberg:

1. Provide the computer drawing for your individual RG setup.


2. Explain your setup.

My circuit will be engaged by a simple switch. Ben should have something that physically pushes the switch. When the switch is closed, it will run a certain voltage value through a relay, which will be higher than the threshold voltage (6v). On the output end of the relay will be a motor that will spin and knock over some dominos. The dominos will trail towards a styrofoam ball. Once the ball is struck, it will fall down a track onto one end of a seesaw, lifting the other end. On the other end, there will be a thumbtack, which will rise and strike, hopefully popping, a balloon. The balloon explosion then should knock over the dominos of the person after me, engaging their circuit.


3. Provide photos of the circuit and setup.
This is a picture of my circuit. It has a switch connected to a relay, which is connected to a motor. 


4. Provide at least two videos of your setup in action, one being a failed attempt.
This is a video showing that the circuit does in fact trip the relay and spin the motor when the switch is pushed.
This is a video showing how the teeter-totter set up should work.

This is a video showing that the styrofoam ball would not be heavy enough to pop the balloon. Failure attempt
The styrofoam was replaced with a marble and the track was made skinnier. Successful attempt at popping the balloon.


5. What failures did you have? How did you overcome them?

My first and most frequent failure was arranging the balloon to the proper position. The pin would either hit the balloon and bounce right back down without popping it, or it would pop the balloon successfully, but the dominos behind the balloon would not fall over. I overcame the balloon not popping situation by filling the balloon with air to the point where the slightest contact with the pin would force it to pop. I have yet to figure out a way of making something physical happen with dominos after the popping of the balloon.

My biggest problem with my RG set up is that the circuit is too basic for a circuits class. I tried to use a touch sensor to trip the relay but it was not working with me. I have added an LED to show when the power is switched on. I'm thinking about adding a timer before the motor begins to spin, to add more time and circuitry to my set up. 

6.  Group task: Explain your group RG set up.

Ben will begin by receiving a voltage source from someone before him. When his circuit powers on, a motor will pull a string attached to a fan. When the fan is pulled, a lego barrier will be lifted, allowing a toy car to roll down a hill, where it will hit a marble. The marble will roll down a lego track. It will fall down a ramp, where it will strike my switch, hopefully with enough force. The switch will power on my circuit, allowing my motor to hit the dominos over, reaching a point where the dominos knock a bar into a marble, causing the marble to fall down the track and land on the teeter-totter device. On the opposite end of the teeter totter is a thumbtack, which will pop a balloon, hopefully causing another set of dominos to fall over. 

7. Video of a test run of your group RG. 

We have yet to make a video together, as we are working on making a way for bens marble to trigger the switch with a good amount of force. This is more difficult than it seems but I think we can figure it out.

Sunday, April 10, 2016

Ben's Individual Rube Goldberg

Individual Rube Goldberg:

1. Provide the computer drawing for your individual RG setup.


2. Explain your setup.

My Rube Goldberg set up starts with a DC voltage signal coming off of Austin's project. Because his signal will be a high voltage, low current signal it will immediately switch over a relay so reset the power input to a more standard level. The relay will turn off a LED and start a DC motor. The motor will wind up some floss that is acting like string. The floss will pull on the fan blades, causing the stopping block in front of the car to be removed. The car will roll down the track and will knock a marble down a Lego track. Once at the bottom the marble will roll and hit the touch sensor to start Matt's project.

3. Provide photos of the circuit and setup.

Circuit setup for the Rube Goldberg project


4. Provide at least two videos of your setup in action, one being a failed attempt.


This is a test of the 'mechanical side of my Rube Goldberg project


5. What failures did you have? How did you overcome them?

I had an issue with getting the vehicle to go down the ramp without falling off and without stopping short of knocking over the marble. I changed the tricycle style bike into a makeshift car with four wheels so it would not veer off the ramp all the time, and I adjusted the ramp and the platform after it so the car would travel farther.

Wednesday, April 6, 2016

Matt's Individual Rube Goldberg

Individual Rube Goldberg:

1. Provide the computer drawing for your individual RG setup.


2. Explain your setup.

My circuit will be engaged by a simple switch. Ben should have something that physically pushes the switch. When the switch is closed, it will run a certain voltage value through a relay, which will be higher than the threshold voltage (6v). On the output end of the relay will be a motor that will spin and knock over some dominos. The dominos will trail towards a styrofoam ball. Once the ball is struck, it will fall down a track onto one end of a seesaw, lifting the other end. On the other end, there will be a thumbtack, which will rise and strike, hopefully popping, a balloon. The balloon explosion then should knock over the dominos of the person after me, engaging their circuit.


3. Provide photos of the circuit and setup.


4. Provide at least two videos of your setup in action, one being a failed attempt.


5. What failures did you have? How did you overcome them?


Monday, March 28, 2016

Week Eleven Blog

Week Eleven:

Part A: Strain Gauges:

1. Connect the oscilloscope probes to the strain gauge. Record the peak voltage values (positive and negative) by tapping the gauge with low and high pressure. Make sure to set the oscilloscope horizontal and vertical scales appropriately so you can read the values. DO NOT USE the measure tool of the oscilloscope. Adjust your oscilloscope so you can read the values from the screen.


These are the values found from the oscilloscope, it seems that the higher the tapping or pressure we exert on gauge the more output voltage there is.

2. Press the "Single" button below the Autoscale button on the oscilloscope. This mode will allow you to capture a single change at the output. Adjust your time and amplitude scales so you have the best resolution for your signal when you tap your strain gauge. Provide a photo of the oscilloscope graph.


Part B: Half-Wave Rectifiers

1. Construct the following half-wave rectifier. Measure the input and the output using the oscilloscope and provide a snapshot of the outputs.


2. Calculate the effective voltage of the input and output and compare the values with the measured ones by completing the following table.


3. Construct the following circuit and record the output voltage using both the DMM and the oscilloscope.


4. Replace the 1 microF capacitor with 47 microF and repeat the previous step. What has changed?


We observed a smaller output voltage when we increased the capacitor used in the circuit. This is probably due to the larger capacitor storing more of the energy than that of the smaller one.

Part C: Energy Harvesters

1. Construct the half-wave rectifier circuit without the resistor but with the 1 microF capacitor. Instead of the function generator, use the strain gauge. Discharge the capacitor every time you start a new measurement. Tap your strain gauge and observe the output voltage. Fill out the table below:


2. Briefly explain your results.

The longer the tapping went or the harder we tapped the output voltage would increase. And it would continue to increase until it got into the 100 mV range, that is when it would start fluctuating on the increasing. Once in got about 150 mV it did not want to stay up that high and would drop just as often as it would rise.

3. If we do not use the diode in the circuit (i.e. using only strain gauge to charge the capacitor), what would you observe at the output? Why?

We would observe no significant change in the output voltage of the capacitor. This is due to the sinusoidal curve of an AC signal. The diode allows only one polarity through (positive or negative) and that allows the capacitor to store up energy. If the whole signal comes through to the capacitor, the negative and the positive would cancel each other out at the capacitor, ensuring that the capacitor never has any energy stored in it.


Monday, March 21, 2016

Week Ten Blog

Part A:   MATLAB Practice

1. Open matlab. Copy and paste the appropriate code, name it, then post an image of the resulting plot here.


2. What does clear all do?

Clear all clears all work in the workspace.

3. What does close all do?

Close all removes specified figures. The specified figures in this case are "all", so everything prior to this command is to be closed. 

4. In the command line, type x and press enter. This is a matrix, how many rows and columns are in the matrix?

When you type x into matlab, the resulting matrix has 1 row and 5 columns for numbers 1-5.

5. Why is there a semicolon at the end of line x and y?

There is a semicolon at the end of line x and y to show that they are two different commands. Without the semicolon, matlab will read them all as one command. It basically "enters" between the commands to show that they are separate from each other. 

6. Remove the dot on the y=2.^x; line and execute the code again. What does the error message mean?

The error message says that inputs must be a scalar and a square matrix. To use exponents, you must use (.^) instead of (^). 

7. How does the linewidth affect the plot? Explain

The linewidth of a plot is the thickness of the resulting line. As you increase the linewidth, the accuracy and precision of the plot decrease. The line covers more area of the plot when the linewidth is thicker and therefore, you cant read the graph very precisely. 

8. Type help plot on the command line and study the options for plot command. Provide how you would change the line for plot command to obtain the following figure. (Hint: Like 'Linewidth', there is another property called 'MarkerSize')

This is the given plot in which we should try to match

To add the circles, we use the command "ro-". The 'r' stands for red, the 'o' creates the circles at each point of slope change, and the '-' creates a solid line. We made the 'MarkerSize' to be 12, and the 'LineWidth' to be 4.


9. What happens if you change the line for x to x=[1; 2; 3; 4; 5]; ? Explain.

There is no change when you add semicolons in between the numbers.

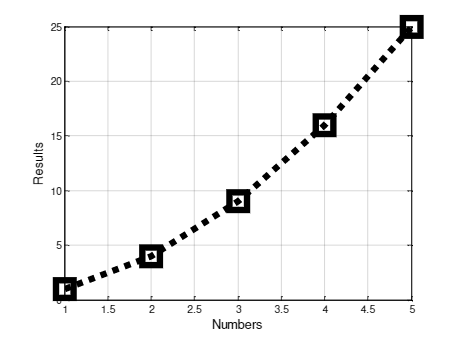
10. Provide the code for the following figure. You need to figure out the function for y. Notice there are grids on the plot. 

Figure we should match. The equation for this line is y=x^2

To create this graph, we must label both axes, add squares around the points of interest, create a dotted line, and add a grid to the background. This is the code we used to do so.


11. Degree vs Radian in Matlab:
a. Calculate the sinus of 30 degrees using a calculator or the internet.

Sin(30) using a calculator in degree mode gives 0.5.

b. Type sin(30) in the command line of matlab. Why is this number different? (Hint: Matlab treats angles as radians)

When typing sin(30) into matlab, we get the number -0.9880. This number is different because Matlab read 30 as 30 radians instead of 30 degrees. 

c. How can you modify sin(30) so we get the correct number?

To modify the way Matlab sees 30, we should type 'sind' instead of 'sin' to show that we are using degrees, not radians. 

Our final code for calculating sin(30) is 'Sind(30)=0.5'.

12. Plot y=10sin(100t) using Matlab with two different resolutions on the same plot: 10 points per period and 1000 points per period. The plot needs to show only 2 periods. Provide your code and resulting figure. The output figure should look like the following:


This is the code we used to create the following plot

This is the resulting plot, which matches the original plot


13. Explain what is changed in the following plot compared to the previous one.

14. The command find was used to create this code. Study the use of find and try to replicate the plot above. Show the code you used. 


Part B: Filters and MATLAB
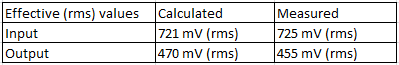
1. Build a low pass filter in which the cutoff frequency is 1KHz. Observe the output using the oscilloscope. Collect several data points around the cutoff frequency. Provide your data in a table.

This is our data table with multiple points for the low pass filter


2. Plot your data using MATLAB. Use proper labels and make everything readable. Provide your code as well.

This is the code used to create the following plot

This is the resulting plot. As you can see, the cutoff frequency is around 1 kHz


3. Calculate the cutoff frequency using MATLAB. The find command will be used as well. Provide your code.


5. Build a high pass filter in which the cutoff frequency is 1KHz. Observe the output using the oscilloscope. Collect several data points around the cutoff frequency. Provide your data in a table.


This is our data table with multiple points for the low pass filter.

6. Plot your data using MATLAB. Use proper labels and make everything readable. Provide your code as well.


7. Calculate the cutoff frequency using MATLAB. The find command will be used as well. Provide your code.