Part A: Strain Gauges:
1. Connect the oscilloscope probes to the strain gauge. Record the peak voltage values (positive and negative) by tapping the gauge with low and high pressure. Make sure to set the oscilloscope horizontal and vertical scales appropriately so you can read the values. DO NOT USE the measure tool of the oscilloscope. Adjust your oscilloscope so you can read the values from the screen.

2. Press the "Single" button below the Autoscale button on the oscilloscope. This mode will allow you to capture a single change at the output. Adjust your time and amplitude scales so you have the best resolution for your signal when you tap your strain gauge. Provide a photo of the oscilloscope graph.

Part B: Half-Wave Rectifiers
1. Construct the following half-wave rectifier. Measure the input and the output using the oscilloscope and provide a snapshot of the outputs.


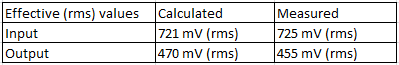
2. Calculate the effective voltage of the input and output and compare the values with the measured ones by completing the following table.
3. Construct the following circuit and record the output voltage using both the DMM and the oscilloscope.


4. Replace the 1 microF capacitor with 47 microF and repeat the previous step. What has changed?

We observed a smaller output voltage when we increased the capacitor used in the circuit. This is probably due to the larger capacitor storing more of the energy than that of the smaller one.
Part C: Energy Harvesters
1. Construct the half-wave rectifier circuit without the resistor but with the 1 microF capacitor. Instead of the function generator, use the strain gauge. Discharge the capacitor every time you start a new measurement. Tap your strain gauge and observe the output voltage. Fill out the table below:

2. Briefly explain your results.
The longer the tapping went or the harder we tapped the output voltage would increase. And it would continue to increase until it got into the 100 mV range, that is when it would start fluctuating on the increasing. Once in got about 150 mV it did not want to stay up that high and would drop just as often as it would rise.
3. If we do not use the diode in the circuit (i.e. using only strain gauge to charge the capacitor), what would you observe at the output? Why?
We would observe no significant change in the output voltage of the capacitor. This is due to the sinusoidal curve of an AC signal. The diode allows only one polarity through (positive or negative) and that allows the capacitor to store up energy. If the whole signal comes through to the capacitor, the negative and the positive would cancel each other out at the capacitor, ensuring that the capacitor never has any energy stored in it.
We got the same results for Part C question 1, others seem to have gotten much different results. Do you think we are correct or them?
ReplyDeleteThe capacitor used and the strain gauge used play a big part in those numbers. Odds are both are correct in the sense that we measured the values the same way, just the equipment is different, or one of the gauges could be bad. Our strain gauge ended up quitting on us shortly after we had finished part C.
DeleteBlog looks good, easy to read and see your results. Our team had an issue with part C also, seems that many teams has some sort of issue with the strain gauge portion of this lab.
ReplyDeleteI think it has something to do with the gauges being old and worn out. Ours was very unreliable on actually outputting a voltage when pressure was applied.
DeleteHey! You said that the voltage of the 'energy harvester' didn't want to stay much above 150 mV. Do you remember what the highest value you saw was?
ReplyDeleteNick
We saw it reach about 200 mV but that was tapping much faster than what the lab asked for and we could only do it once, we could not recreate it going that high when we tried it again.
DeleteI agree with most of your results, although I'm wondering why your tapping outputs are so low in part c. How hard were you tapping? We noticed that the capacitor really started to charge if the taps were very hard. Otherwise we got similar results, although still not that low. Although, we did get large numbers on part a as well, so maybe it was a problem with your gauge?
ReplyDeleteOur gauge was very unreliable in being consistent in its output and its readings. We were tapping hard but only with our fingers and not with a pen or some other hard object.
DeleteIt looks like in Part B and beyond, you used an input voltage of 2 Vpp instead of 10 Vpp, which made all of your results quite a bit smaller than the other groups. There's nothing wrong with this, I would just make sure you mention it somewhere. The smaller results confused me at first. Also, it might be worthwhile to make your tables a little bigger in the future--they are a little difficult to read currently.
ReplyDeleteWell, we actually were using 10 Vpp, we have no idea why our values are so low. We did think it was weird that out of 10 Vpp, only a couple hundred mV was ever observed.
DeleteLoved the conversations here. Thanks.
ReplyDelete