1. Open matlab. Copy and paste the appropriate code, name it, then post an image of the resulting plot here.

2. What does clear all do?
Clear all clears all work in the workspace.
Clear all clears all work in the workspace.
3. What does close all do?
Close all removes specified figures. The specified figures in this case are "all", so everything prior to this command is to be closed.
Close all removes specified figures. The specified figures in this case are "all", so everything prior to this command is to be closed.
4. In the command line, type x and press enter. This is a matrix, how many rows and columns are in the matrix?
When you type x into matlab, the resulting matrix has 1 row and 5 columns for numbers 1-5.
5. Why is there a semicolon at the end of line x and y?
There is a semicolon at the end of line x and y to show that they are two different commands. Without the semicolon, matlab will read them all as one command. It basically "enters" between the commands to show that they are separate from each other.
There is a semicolon at the end of line x and y to show that they are two different commands. Without the semicolon, matlab will read them all as one command. It basically "enters" between the commands to show that they are separate from each other.
6. Remove the dot on the y=2.^x; line and execute the code again. What does the error message mean?
The error message says that inputs must be a scalar and a square matrix. To use exponents, you must use (.^) instead of (^).
The error message says that inputs must be a scalar and a square matrix. To use exponents, you must use (.^) instead of (^).
7. How does the linewidth affect the plot? Explain
The linewidth of a plot is the thickness of the resulting line. As you increase the linewidth, the accuracy and precision of the plot decrease. The line covers more area of the plot when the linewidth is thicker and therefore, you cant read the graph very precisely.
The linewidth of a plot is the thickness of the resulting line. As you increase the linewidth, the accuracy and precision of the plot decrease. The line covers more area of the plot when the linewidth is thicker and therefore, you cant read the graph very precisely.
8. Type help plot on the command line and study the options for plot command. Provide how you would change the line for plot command to obtain the following figure. (Hint: Like 'Linewidth', there is another property called 'MarkerSize')

This is the given plot in which we should try to match
To add the circles, we use the command "ro-". The 'r' stands for red, the 'o' creates the circles at each point of slope change, and the '-' creates a solid line. We made the 'MarkerSize' to be 12, and the 'LineWidth' to be 4.

9. What happens if you change the line for x to x=[1; 2; 3; 4; 5]; ? Explain.
There is no change when you add semicolons in between the numbers.
10. Provide the code for the following figure. You need to figure out the function for y. Notice there are grids on the plot.
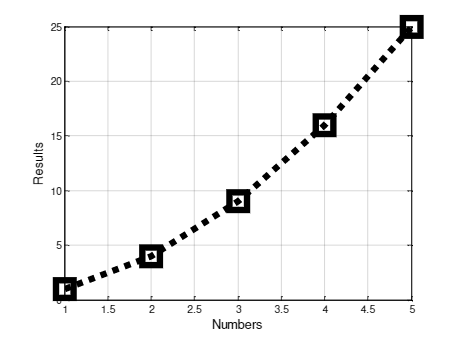
Figure we should match. The equation for this line is y=x^2
To create this graph, we must label both axes, add squares around the points of interest, create a dotted line, and add a grid to the background. This is the code we used to do so.

11. Degree vs Radian in Matlab:
a. Calculate the sinus of 30 degrees using a calculator or the internet.
Sin(30) using a calculator in degree mode gives 0.5.
b. Type sin(30) in the command line of matlab. Why is this number different? (Hint: Matlab treats angles as radians)
When typing sin(30) into matlab, we get the number -0.9880. This number is different because Matlab read 30 as 30 radians instead of 30 degrees.
c. How can you modify sin(30) so we get the correct number?
To modify the way Matlab sees 30, we should type 'sind' instead of 'sin' to show that we are using degrees, not radians.
Our final code for calculating sin(30) is 'Sind(30)=0.5'.
12. Plot y=10sin(100t) using Matlab with two different resolutions on the same plot: 10 points per period and 1000 points per period. The plot needs to show only 2 periods. Provide your code and resulting figure. The output figure should look like the following:


This is the code we used to create the following plot

This is the resulting plot, which matches the original plot
13. Explain what is changed in the following plot compared to the previous one.

14. The command find was used to create this code. Study the use of find and try to replicate the plot above. Show the code you used.


Part B: Filters and MATLAB
1. Build a low pass filter in which the cutoff frequency is 1KHz. Observe the output using the oscilloscope. Collect several data points around the cutoff frequency. Provide your data in a table.

This is our data table with multiple points for the low pass filter
2. Plot your data using MATLAB. Use proper labels and make everything readable. Provide your code as well.

This is the code used to create the following plot

This is the resulting plot. As you can see, the cutoff frequency is around 1 kHz
3. Calculate the cutoff frequency using MATLAB. The find command will be used as well. Provide your code.

5. Build a high pass filter in which the cutoff frequency is 1KHz. Observe the output using the oscilloscope. Collect several data points around the cutoff frequency. Provide your data in a table.

This is our data table with multiple points for the low pass filter.
6. Plot your data using MATLAB. Use proper labels and make everything readable. Provide your code as well.


7. Calculate the cutoff frequency using MATLAB. The find command will be used as well. Provide your code.
I like it, I cant really see so for me it would be great if you could make your code bigger. But apart from my inability to see, I really liked the blog, good job.
ReplyDeleteIt is smaller than we expected, but we can see it so you may be blind. Thanks!
Delete-Matt
Posting the pictures of the actual code from MATLAB along with the plots made your blog very easy to read and understand.
ReplyDeleteThanks we were worried about it being too small to read but that's just John
DeleteFor the Matlab practice, I would double check number 5 and number 9. Try using those codes in Matlab without the semicolons at the end of the lines to better understand how those lines of code are functioning and how the semicolon at the end makes a difference.
ReplyDeleteThanks for the tip, we will definitely try that next time we use MATLAB
DeleteLike Amanda said I would take a closer look at number 5 in part one. Take a close look at the command window output as opposed to the actual figure to see the difference.
ReplyDeleteAs for number 9 I also found it did not make any difference when entered as shown in our instructions, although you will notice a difference if you remove the final semi-colon outside of the closing ].
As for a your blog's formatting I would suggest decreasing the left and right margins of the blog's layout to utilize more of the screen as it is the everything is a bit small and a bit hard to read.
KP
Thanks for all the tips Kevin we will look back over those!
Delete-Matt
I like the way you format your graphs, tables, and code. The spacing seems just right, although I would make them larger.
ReplyDeleteThanks for the compliment we made them ourselves :)
DeleteFor part A #9, the matrix goes from having 1 row and 5 columns to 5 rows and 1 column when the semi-colon's are added. When the semi-colon is placed at the end of the line, it just indicates to MATLAB that nothing needs to be displayed in the command window.
ReplyDeleteThanks for telling us, we were confused when nothing happened.
DeleteI hope you will remember semicolon parts for #5 and 9.
ReplyDelete