1. Perform the functional check.
A functional check should be done before using an Oscilloscope the first time, or the first time after a long time. A functional check will test whether the oscilloscope is working correctly or not.
A functional check should be done before using an Oscilloscope the first time, or the first time after a long time. A functional check will test whether the oscilloscope is working correctly or not.
 |
| This is the displayed wave after the functional check. |
2. Perform manual probe compensation.
Manual probe compensation is where you manually adjust the probe to fine tune it with the oscilloscope. If the probe is not compensated, the probe could be under compensated or over compensated which will make the probe measurements wrong. Below is a picture of our probes before the manual probe compensation. As you can see the wave peaks are not flat, this means the probes were over compensated to begin with. The second picture is displaying the readings after the adjustment, as you can see the wave peaks are flat which means the probes are compensated correctly.
 |
| This is the wave when the probe is over compensated. |
 |
| This is the wave when the probe is corrected. |
3. What does probe attenuation (1x vs 10x) do?
Probe attenuation allows the user to control the bandwidth on the oscilloscope. The 10x setting allows you to use the full bandwidth while the 1x setting limits the oscilloscope bandwidth to 7 MHz.
4. How do vertical and horizontal controls work? Why would you need it?
The vertical control allows you to shift the wave up or down with respect to the center axis. The horizontal control allows you to shift the wave left or right with respect to the center axis. These functions are helpful when you want to read more than one waveform at a time and want to place them over each other or above and below each other for comparison.
The vertical control allows you to shift the wave up or down with respect to the center axis. The horizontal control allows you to shift the wave left or right with respect to the center axis. These functions are helpful when you want to read more than one waveform at a time and want to place them over each other or above and below each other for comparison.
5. Generate a 1 kHz, 1 Vpp around a DC 2V from the function generator.
a. Connect this to the oscilloscope and verify the input signal using the horizontal and vertical readings.
Each horizontal line is separated vertically by 0.5 volts. Our signal reached from the origin to one line above and one line below. This means that from the origin, the wave reaches +0.5V and -0.5V. 0.5-(-0.5)=1 V peak to peak.
 |
| This is wave from the setup above, centered on the origin. |
b. Figure out how to measure the signal properties using menu buttons on the scope.
When trying to measure signal properties, you should press measure, then source CH 1, then you can cycle through the properties by pressing type.
6. Connect function generator and oscilloscope probes switched. What happens? Why?
When switching the probes, we noticed that the oscilloscope couldn't come up with a distinct measurement. The value is basically zero and noise is displayed. This is because the gator clip on the oscilloscope probe is connected to ground on the oscilloscope. So if you switch them, you are grounding the signal before the probe can read it.
When switching the probes, we noticed that the oscilloscope couldn't come up with a distinct measurement. The value is basically zero and noise is displayed. This is because the gator clip on the oscilloscope probe is connected to ground on the oscilloscope. So if you switch them, you are grounding the signal before the probe can read it.
?
7. After calibrating the second probe, implement the voltage divider current below. Measure the following voltages using the Oscilloscope and comment on your results:

a. Va and Vb at the same time.
The peak to peak voltage of Vb, which is the top wave, is 496mV which means the wave has an amplitude of 248mV. The peak to peak voltage of Va, which is the second value, is 264mV which means the wave has an amplitude of 132mV.
b. Voltage across R4.

a. Va and Vb at the same time.
 |
| The Va and Vb voltages from the problem above. |
In the picture below is the same circuit and probe connections as in part a, but this time the red wave line is the measured difference between Vb and Va. This is helpful because it is the voltage drop over the R4 resistor, which is the same thing as the voltage across R4.
 |
| The same circuit and probe connects as part a, but now with a measured difference wave. |
8. For the same circuit above, measure Va and Vb using the handheld DMM both in AC and DC mode. What are your findings? Explain.
The table below are the measurements of Va, Vb, and R4 using a handheld DMM to measure both AC and DC voltages. We found that the AC voltages measured matched the RMS voltages from the previous experiment. We also found that the difference between Vb and Va matched with the measured value for R4.

9. For the circuit below:
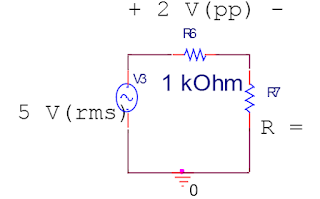
a. Calculate R so the given voltage values are satisfied and make a video explaining.
The video below gives a detailed explanation of how to calculate R so the given voltages are satisfied. The calculated R value is 2.5k ohm.
b. Construct the circuit and measure the values with the DMM and oscilloscope.

The video below gives a detailed explanation of how to calculate R so the given voltages are satisfied. The calculated R value is 2.5k ohm.
b. Construct the circuit and measure the values with the DMM and oscilloscope.
This video shows the circuit constructed and the wave generated
although the numbers don't match part a above. This is because
the voltage input values are different.
10. Operational amplifier basics: Construct the following circuits using the pin diagram of the opamp. The half circle on top of the pin diagram corresponds to the notch on the integrated circuit (IC). Explanations of the pin numbers are below:

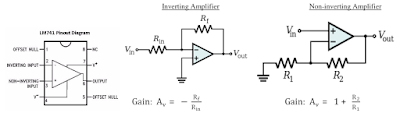
a. Inverting Amplifier: Rin = 1k, Rf = 5k. Apply 1 Vpp @ 1kHz. Observe input and output at the same time. What happens if you slowly increase the input voltage up to 5V? Explain your findings.
When the input voltage increases from 0.5V to 5.0V, the peak to peak value of the wave will increase until it reaches 10V, there the value will no longer increase even if the input voltage keeps increasing. In this video the Vout reached 10Vpp at around Vin = 1V, from there the output voltage no longer increased, even when we got to Vin = 5V, Vout still only read 10Vpp.
b. Non-inverting Amplifier: R1 = 1k, Rf = 5k. Apply 1 Vpp @ 1kHz. Observe input and output at the same time. What happens if you slowly increase the input voltage up to 5V? Explain your findings.
The voltage out on the non-inverted amplifier starts relatively close to the voltage in when the voltage in is small. But as the voltage in increases, the voltage out increases far greater. But just like the inverted amplifier, this amplifier stops increasing after a certain voltage value. The voltage out for this amplifier stops at Vout = 20Vpp. The video below shows this happening.
What were you guys doing up at 5 AM? Anyway, the formatting and pictures are clear and concise, as well as your descriptions. I think it would be a good idea to caption the pictures though.
ReplyDeleteDoing circuit's lab obviously, though in our defense it says 5:46 AM. Why are you commenting at 6:15 AM about us posting 30 min before you commented.
DeleteThe stuff that is finished looks good, obviously needs finished. I agree with Mason, captions do not forget those.
ReplyDeleteWill do!
Delete#3 and 4 are not satisfactory.
ReplyDeleteVideos need captioning as well.