1. Use the transistor by itself. The goal is to create the graph for IC versus VBE. Connect base and collector. Use 10k potentiometer to generate the voltage. Use 5V but DO NOT EXCEED 1V for VBE. Make sure you have the required voltage value set before applying it to the base. Transistor might get really hot. Do not TOUCH THE TRANSISTOR! Make sure to get enough data points to graph.
 |
| Table of the data points collected at IC and VBE. |
 |
| Graph of the data point in the table to the right. |
2. Create the graph for IC versus VCE. Vary VCE from 0V to 5V. Do this measurement for 3 different VBE values: 0V, 0.7V, and 0.8V. The circuit should look like:
 |
| Circuit Design. |
 |
| Graph of the measured current over the collector versus the voltage difference of the collector to the emitter, for a given voltage difference over the base to the emitter. |
3. Apply the following bias voltages and fill out the table. How is IC and IB related? Does your data support your theory?
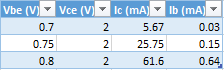 |
| Table of voltage and current values of a transistor. |
4. Explain photocell outputs with different light settings. Create a table for the light conditions and photocell resistance.
A photocell works by changing its resistance values based on the amount of light that reaches the cell. The more light it receives the smaller the resistance value is; likewise the less light it receives the higher the resistance values becomes.
 |
| Table of resistance values of the photocell at varying light levels |
5. Apply voltage (0 to 5V with 1V steps) to DC motor directly and measure the current using the DMM.
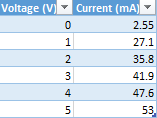 |
| Table of the currents measured in the DC motor at given voltages |
6. Apply 2V to the DC motor and measure the current. Repeat this by increasing the load on the DC motor. Slighting pinching the shaft would do the trick.
As the load on the DC motor is increased the current measured across the motor also increases. Below is a table showing the change in the current across the table when the load on the motor is increased.
 |
| Table showing the change in current when load is increased on the DC motor |
7. Create the circuit below. Explain the operation in detail.
 |
| Circuit design of the DC motor that incorporates a photoresistor. |
In this circuit a 5V power source goes through a photoresistor and splits between the base pin of a transistor and a 1k resistor. The voltage going to the base of the transistor activates the transistor allowing the current and voltage of the other power source to flow through. From the 10V power source the voltage travels through a 47 Ohm resistor into the collector of the transistor. If there is enough voltage being applied to the base, the voltage continues through the transistor into the DC motor which causes the motor to spin. If the resistance value of the photoresistor is too great, not enough voltage will reach the base of the transistor and the DC motor will not activate.
Below is the video of the above circuit in application.
8. Explain R4's role by changing its value to a smaller and bigger resistors and observing the voltage and current at the collector of the transistor.
The resistor R4 buffers the transistor from the voltage being inputted by the power source. If we decrease the resistance value in R4 the current and voltage at the collector of the transistor will increase. Likewise, if the resistance value for R4 is increased then the current and voltage across the collector become smaller.
9. Create your own Rube Goldberg setup.
Our Rube Goldberg design is to use the DC motor to wind up a piece of floss, shortening it so that it flips a bowl over to deposit food into Matt's fish bowl. Henry the VIII, Matt's fish, demands that Matt feeds him the moment he turns on the light when he comes home.
In the video we show how the design works in application. We could not shut the room lights off in the video because there were other people in the lab that needed the lights on. We simulated having the room lights off by Matt putting his finger over the photoresistor. In the video you can hear the power source being switched on but nothing happens until Matt removes his hand from the photocell. This way, the circuit can be switched on when Matt leaves for the day but Henry the VIII will only be fed when Matt returns and turns on the lights.
This is the video of our Rube Goldberg Design in application.
Your tables and graphs look good.
ReplyDeleteBesides the questions that you haven't filled out yet, the blog looks perfectly setup and has everything that is required. Nice work!
ReplyDeleteThank You! We'll get right on finishing it up!
DeleteHey guys, loving the graphs in 1 and 2. How did you make them? They seem like big samples, something our group may need to work on. On number 6, we're not sure if that's your full answer or not. If it is, you should probably add some data on it. The format is clear and concise as well.
ReplyDelete-Mason and Austin
Thank you! The graphs were made in Excel. Number 6 was not finished yet, it was just holding the idea of what was going on for us to come back to it later.
DeleteI really like the look of your blog. And great job collecting so much data for the questions. The extra data points really confirm the relationships on your graphs
ReplyDeleteThank you!
Delete1, 2, 5: No explanations
ReplyDelete3: good try in the explanation. But not quite right.
Rube Goldberg: Henry the VIII! Nice touch!
Love your Rube Goldberg! Henry the VIII lol
ReplyDelete